Multi-timeframe trend scanning

Find trend-aligned stocks faster

Scan hundreds of stocks across multiple timeframes in minutes, not hours.

StockSonar shows whether each stock is bullish, bearish, or neutral across daily, 4h, 1h, 15m, and 5m trends so you can spot alignment, divergence, and emerging setups before you start flipping through charts.

See the Workflow
5
Core timeframes
3
Trend states
1
Focused watchlist

The old workflow

Manual chart scanning does not scale

If you trade from trend structure, you already know the work: open TradingView, review chart after chart, tag the daily trend, repeat the process on intraday timeframes, then try to remember what deserves attention when the market opens.

Hundreds of charts

Scanning a large universe by hand turns good analysis into busywork.

Multiple timeframes

A daily trend is useful, but the setup gets clearer when 4h, 1h, 15m, and 5m agree.

Intraday changes

Lower timeframes can shift before the bigger chart looks obvious.

Focus list pressure

The goal is not more symbols. It is knowing which ones deserve a closer look.

What StockSonar does

See trend alignment before you open the chart

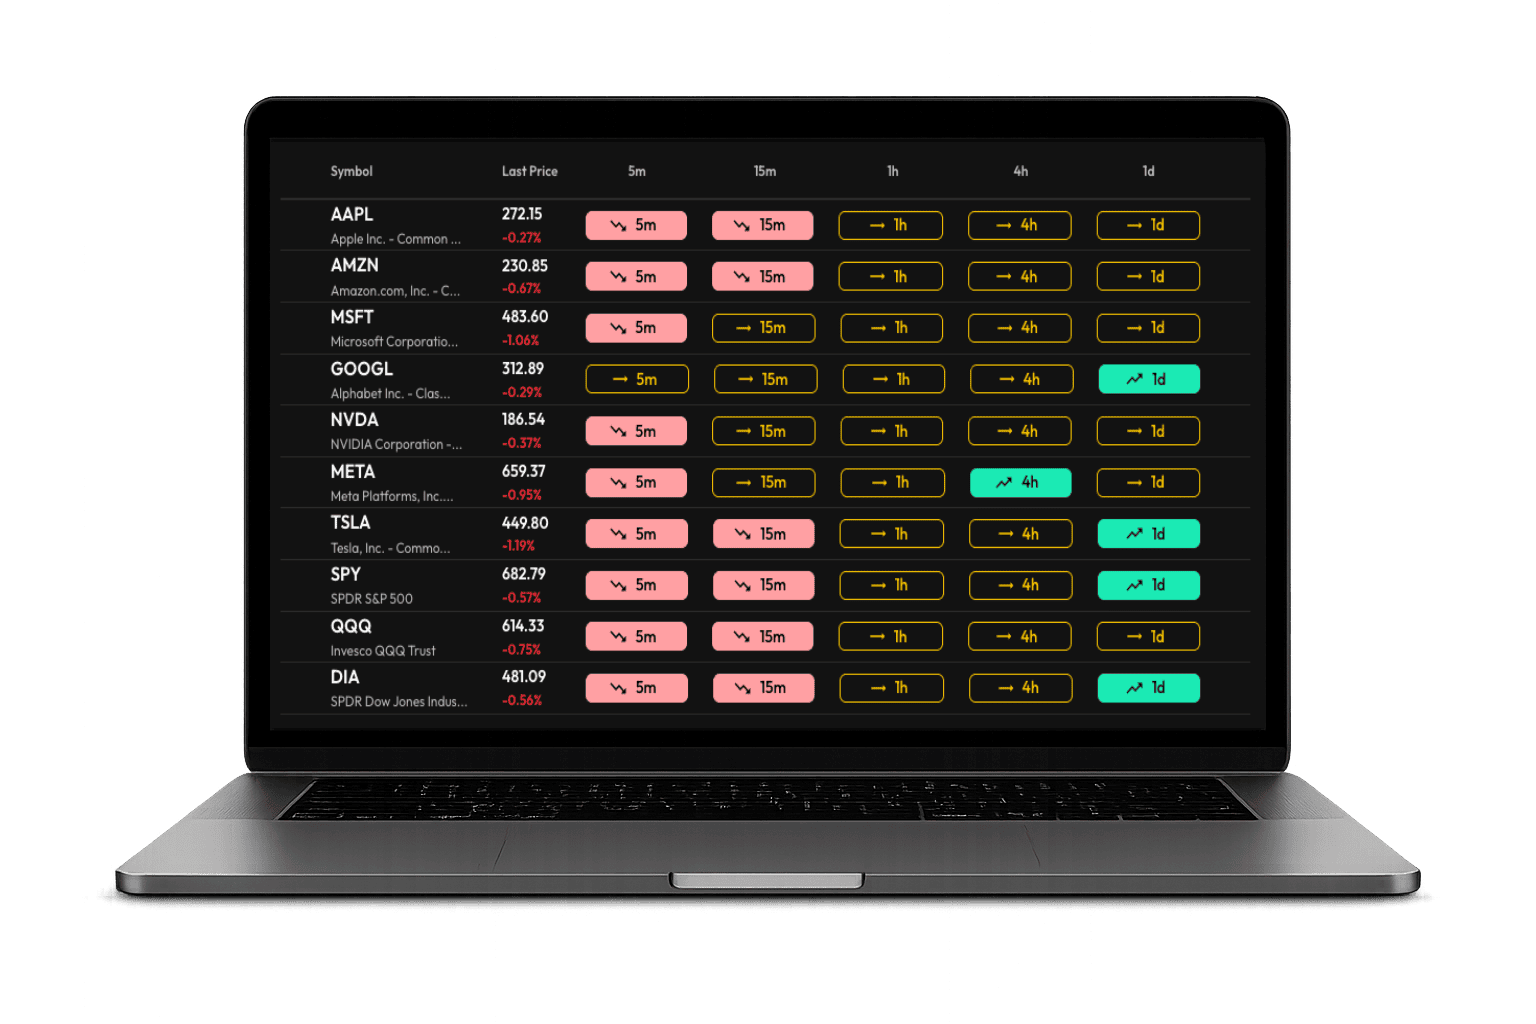
StockSonar turns your watchlist into a multi-timeframe trend grid. Each row shows the current trend state across the timeframes active traders actually use.

Aligned trends

Quickly find names where momentum is stacking across timeframes.

Mixed trends

See when a stock is still developing instead of forcing a setup.

Weak trends

Avoid fighting the larger trend when the structure is not there.

Emerging shifts

Watch lower timeframes turn before the daily chart becomes obvious.

StockSonar dashboard showing multi-timeframe trend states

Why it matters

A bullish 5-minute chart means more when the bigger picture agrees

Most scanners find price, volume, or technical events in isolation. StockSonar is built around context: how the same stock is trending across multiple timeframes at once.

01

Find clean alignment

Quickly spot stocks where the daily, 4h, 1h, 15m, and 5m trends are telling a similar story.

02

Catch early shifts

A stock can start firming up on 5m, 15m, and 1h before the higher timeframes fully turn.

03

Build a better focus list

Start the day with a shorter list of names worth studying instead of a giant list of maybes.

From market scan to focus list

StockSonar is not trying to make the trade for you. It helps you decide what deserves your attention.

1

Load the stocks you care about

Start with your own watchlists, ETFs, indices, or a broader universe you want to monitor.

2

Scan trend states across timeframes

Review bullish, bearish, and neutral trend states from the daily chart down to active intraday timeframes.

3

Drill into the names that line up

Use the dashboard to narrow your focus, then open the chart when the trend picture is worth studying.

Built for traders who already do the work

StockSonar is for traders who use trend, moving averages, and timeframe context to decide what to watch. It does not replace your process. It removes the repetitive scanning that makes the process hard to keep up with.

Signals and codified setups may come later. The first goal is simpler: make it fast to see which stocks are aligned, which are changing, and which ones should make tomorrow's focus list.

How We Use Your Data

When you sign up or join our waitlist, we collect your email address to create your account and send you important updates about Stock Sonar. We never sell your data or share it with third parties for marketing purposes.

Follow the rebuild

Join the waitlist for early access as StockSonar comes back online.